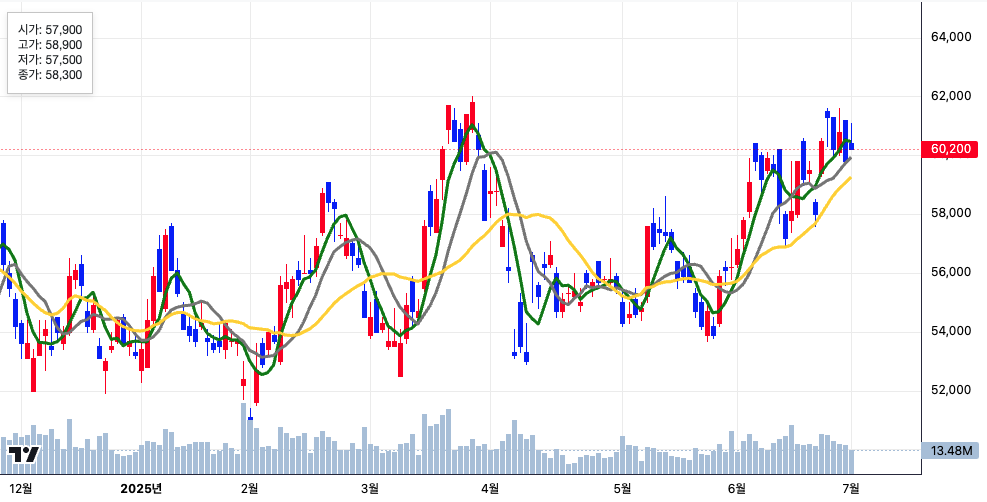
1. 캔들 차트 기본 설정chart = createChart(chartContainerRef.current, { width: chartContainerRef.current.clientWidth, height: 500, layout: { background: { color: '#ffffff' }, textColor: '#000' }, timeScale: { timeVisible: true, secondsVisible: false, rightOffset: 3, barSpacing: 5 }, crosshair: { mode: 1, horzLine: { visible: true }, vertLine: { visible: true } }, grid:..


